ITeachMsu Focus Groups
About Project
The Iteachmsu Commons is an educator-driven space for sharing teaching resources, connecting across educator networks, and growing teaching practice. As a team, we were responsible for building this 0 —> 1 social networking website in under a nine month timeframe.
My Role
User Experience Consultant at Michigan State University Hub for Innovation
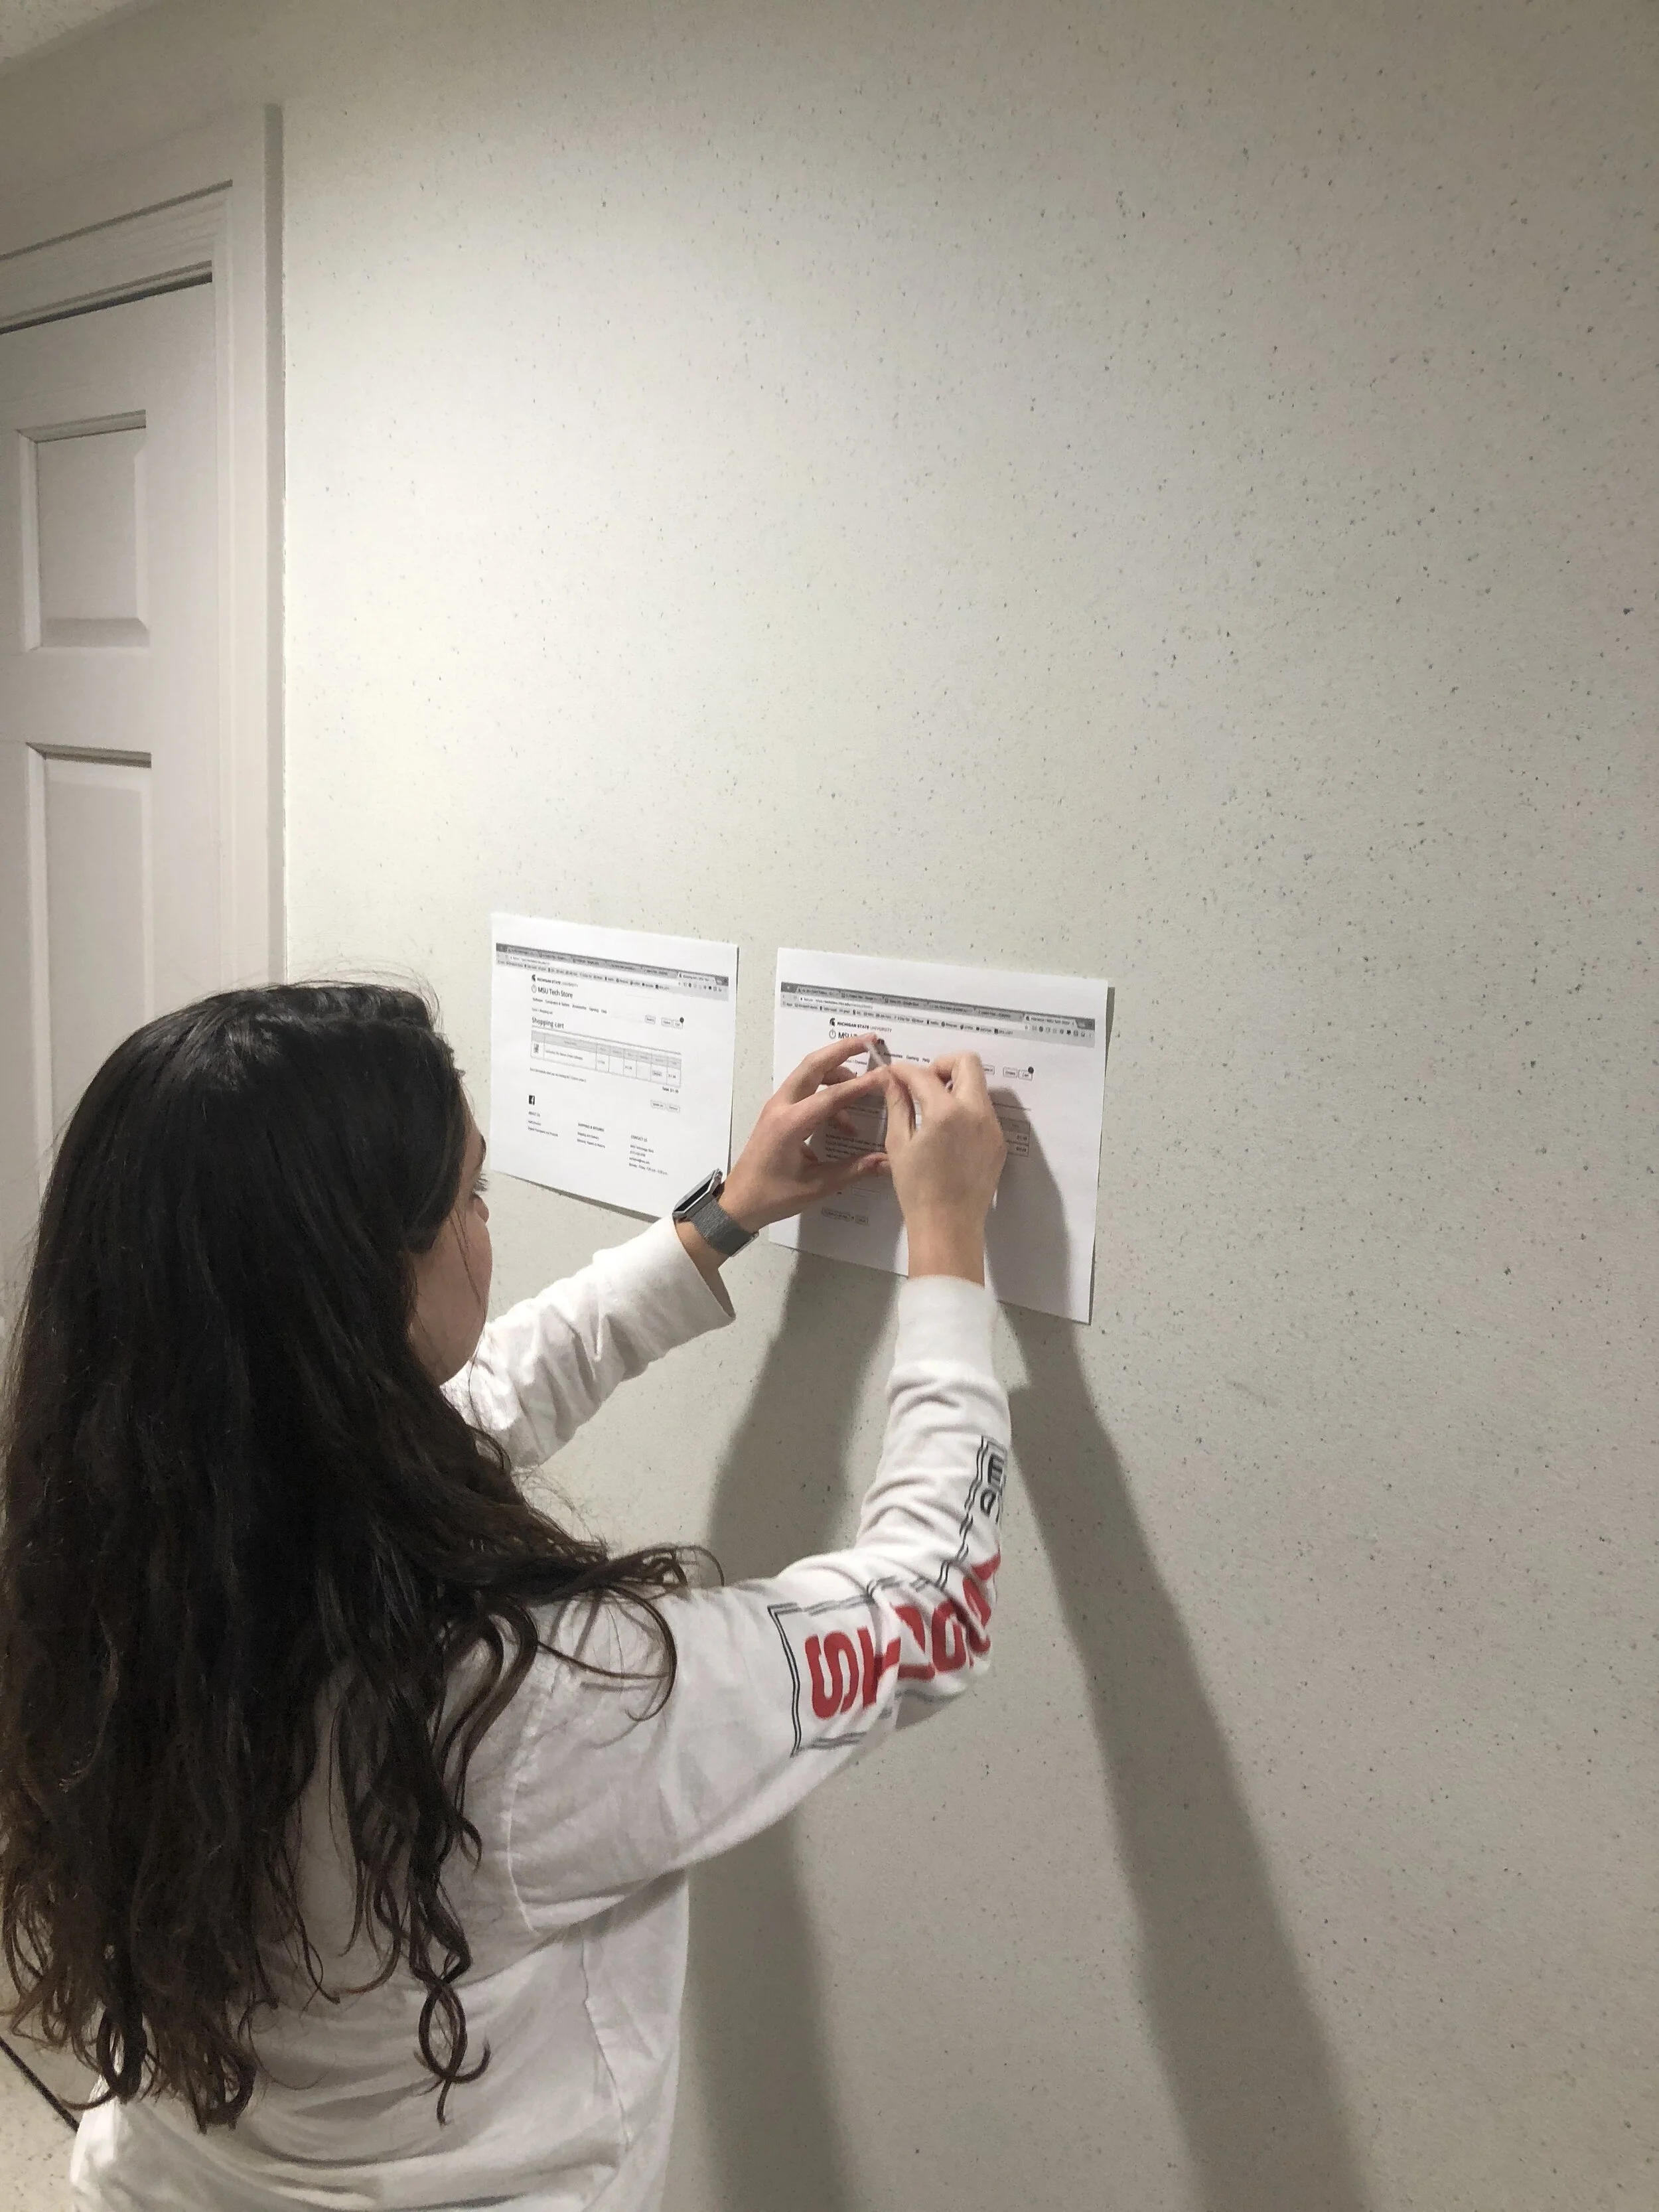
Lizzie putting up analog tasks on the wall.
Focus Group Overview
I co-led the design and facilitation of focus groups to gather actionable user feedback and drive improvements to the ITeachMsu website. Facilitation was a core component of my role at the Hub for Innovation. Over time, I helped elevate both the quality and consistency of our focus groups as we refined our approach and strengthened our facilitation practices.
Across a five-month period, we conducted approximately eight focus groups that ranged from large-scale (10-20 participants) to smaller sessions (4-10 participants). Our participant group primarily included professors and faculty across the university.
Large Sized Focus Group Example
Our focus group structure varied depending on the size and goals. For this example, we have a larger group of 15 participants. We divided the session into two components: analog and digital.
The goal of this study was to evaluate a digital prototype through a hybrid focus group approach. By combining analog activities, such as categorizing content and annotating printed screenshots, with direct interaction with the live prototype, the session aimed to surface deeper user insights and capture the full end-to-end experience. This structure was designed to maintain participant engagement, reduce screen fatigue, and balance detailed data collection with open, meaningful discussion.
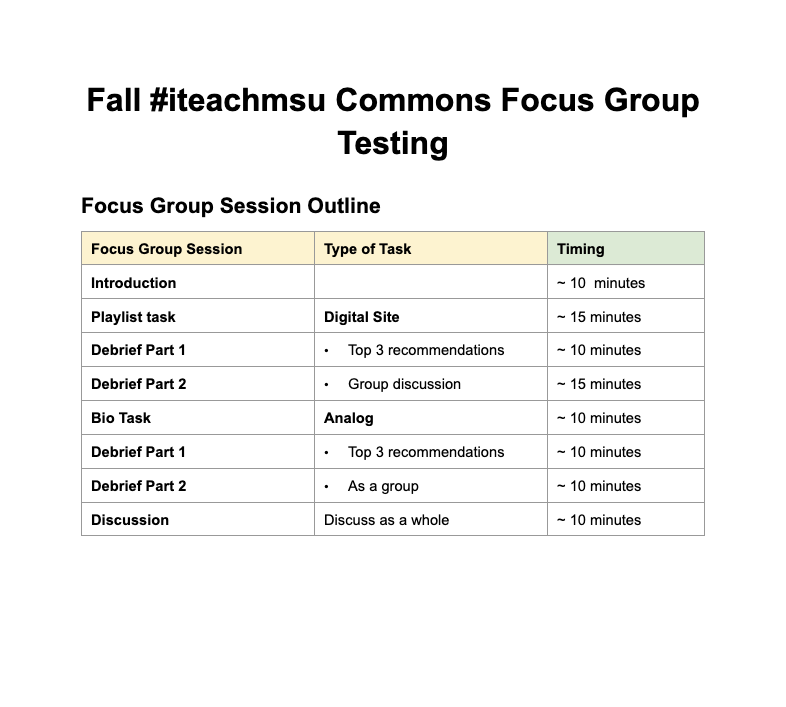
Example Structure of a focus group
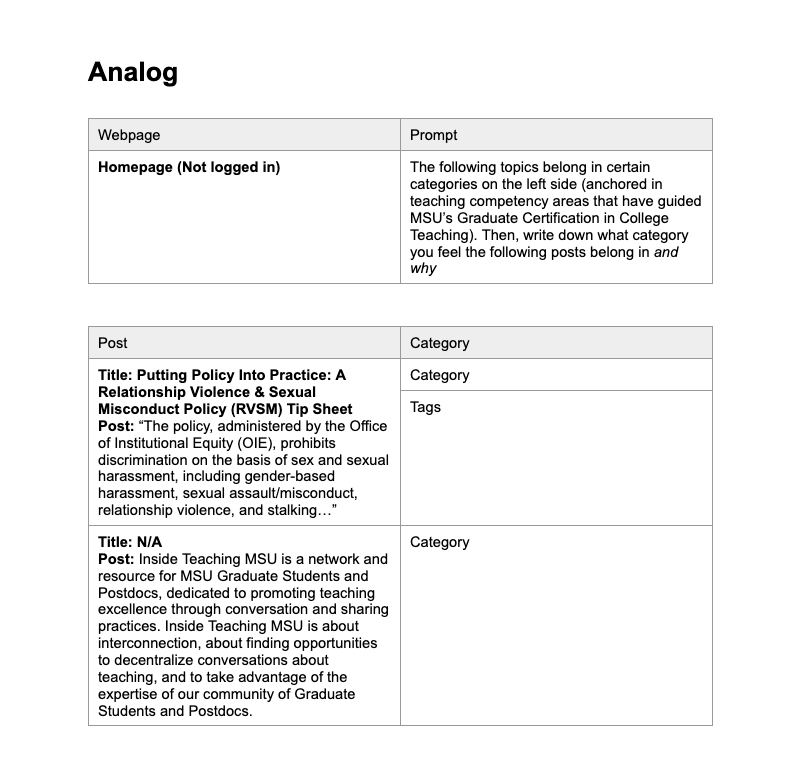
Example of an analog tasks
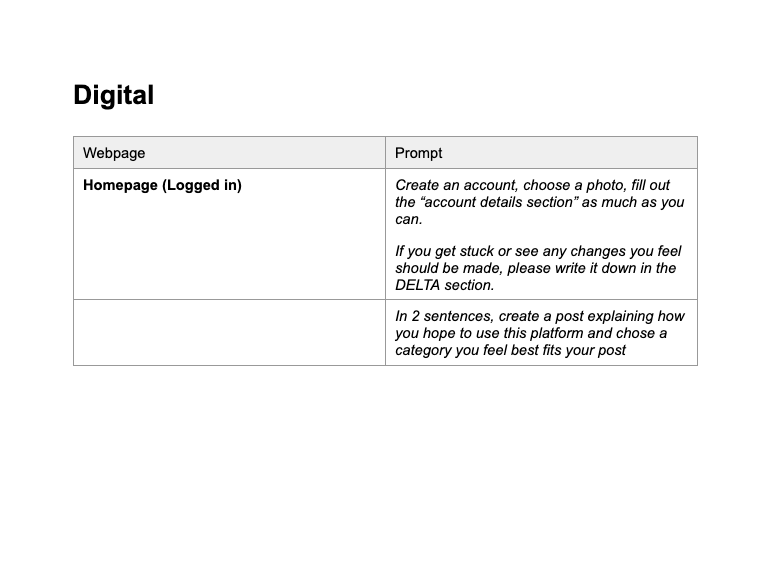
Example of a digital tasks
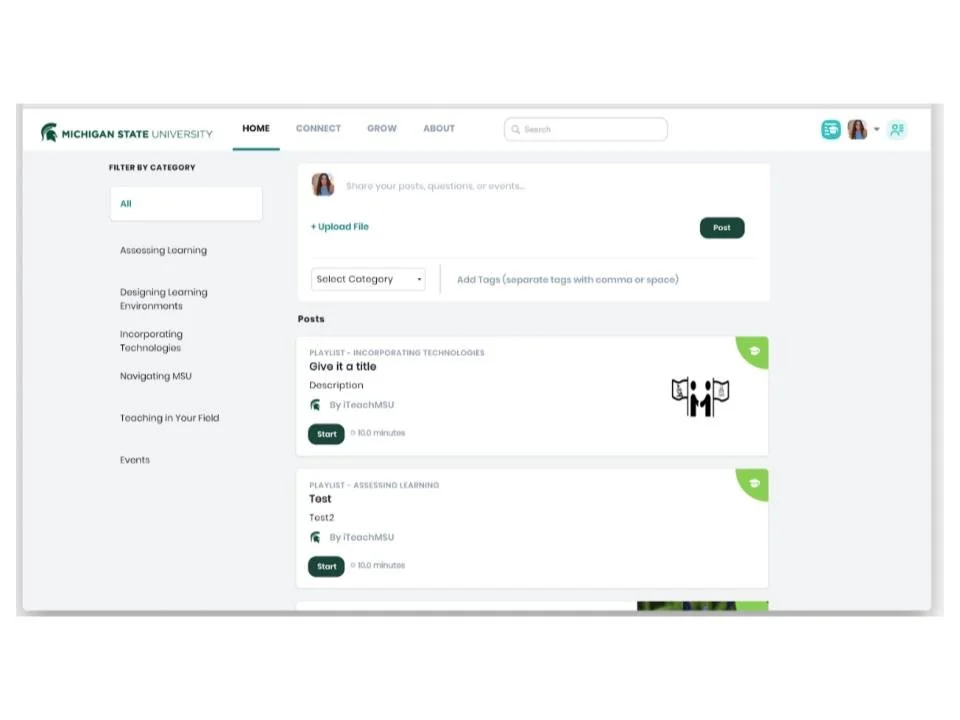
Example of IteachMSU Newsfeed
Feedback Framework
To ensure we captured structured and comprehensive feedback, we implemented a printed worksheet for participants to complete during each task. This was grounded in the “Plus / Delta” Framework. “Pluses” captured what users found intuitive or valuable, while “Deltas” highlighted opportunities for improvement, including suggestions, points of confusion, and areas of friction.
We selected this framework intentionally to encourage more candid input. Recognizing that users can be hesitant to offer direct criticism, pairing positive feedback with opportunities for growth created a more balanced and approachable format. Framing feedback as “Delta,” or change, reinforced that we were actively seeking insights to evolve and improve the product.
In parallel, we documented behavioral observations throughout each session. These two types of feedback in tandem allowed us to gather both implicit and explicit feedback.
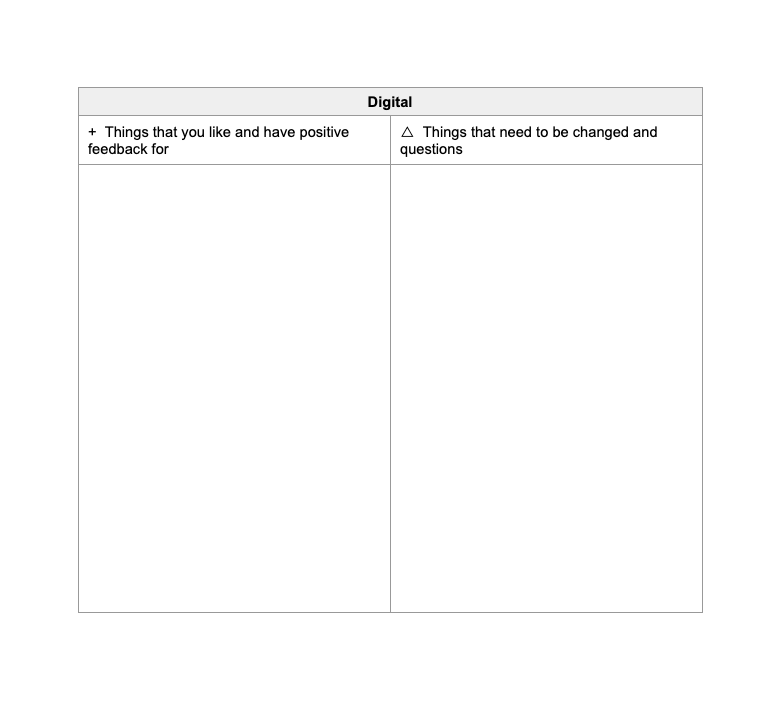
Example of plus and delta sheet
Synthesis
After each session, we conducted an affinity diagram exercise to make sense of the volume of feedback collected. This method allowed us to move beyond surface-level reactions by systematically clustering individual data points, written comments, behavioral observations, and verbal responses, into thematic groups. Rather than treating each piece of feedback in isolation, the affinity diagram surfaced patterns and relationships across participants, giving us a clearer picture of where friction was concentrated and which issues were most pervasive.
This approach ensured that multiple perspectives informed how themes were defined, reducing the risk of confirmation bias in our interpretation. Once themes were established, we prioritized them based on frequency and severity to determine which insights warranted immediate design iteration versus longer-term consideration. This structured synthesis process directly informed our recommendations to the ITeachMsu team and ensured that design decisions were grounded in evidence rather than assumption.
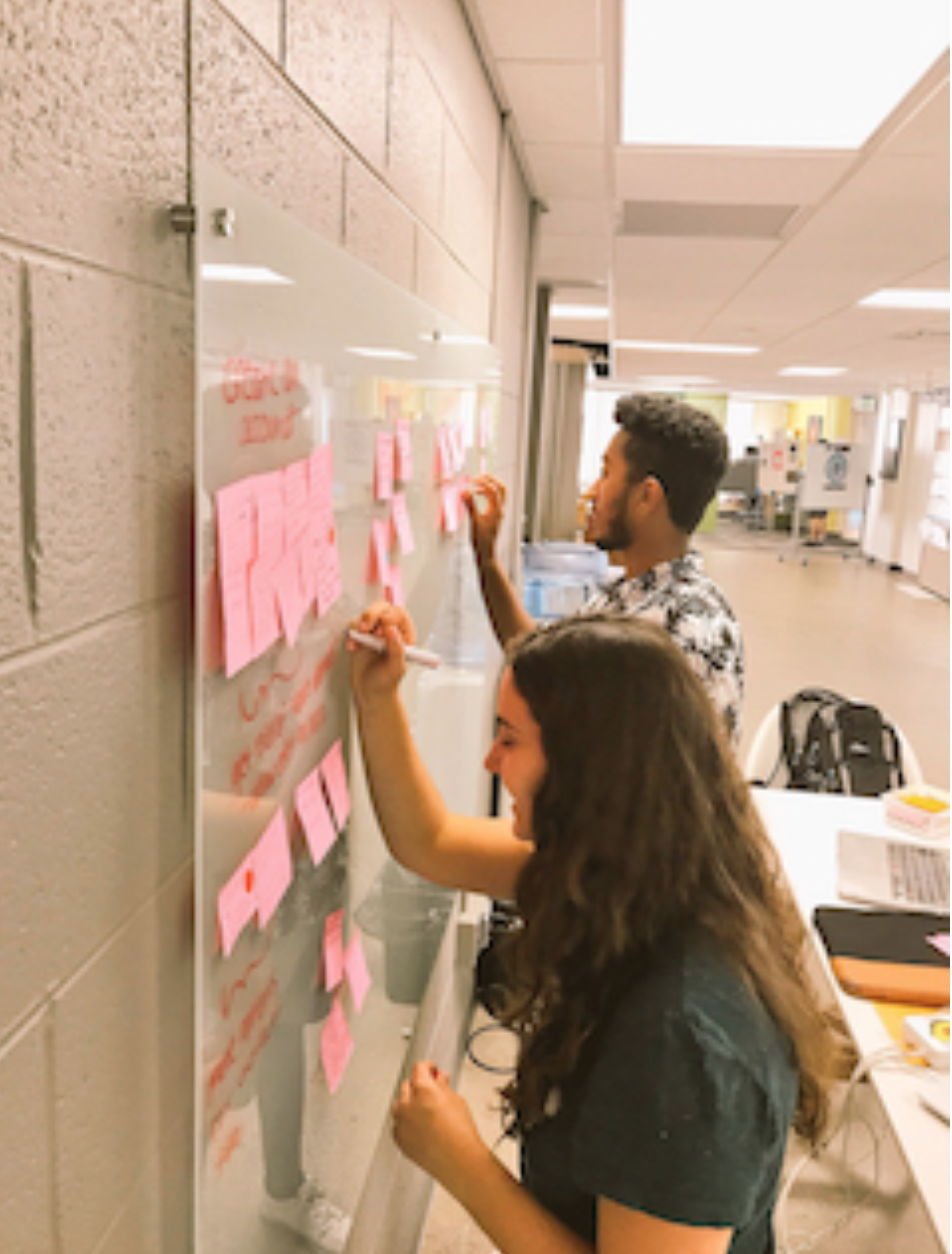
Photo of affinity diagram exercise